Why I rebuilt Karpathy's AI job exposure map
I rebuilt the project from scratch to understand what it actually measures, where it's useful, and where it breaks down.
Andrej Karpathy scored every U.S. occupation for AI exposure last weekend. He pulled the project down by Sunday because people immediately read it as a job-loss forecast. He was right to be concerned. Exposure isn't replacement.
I rebuilt his visualization, because the underlying question matters too much to leave sitting in misinterpretation. The pattern in the data is there, and it's worth understanding clearly before organizations start making decisions from it.
Exposure is not replacement
A score of 8 for software developers doesn't mean 80% of developers lose their jobs. It means AI can perform or assist with a large share of their daily tasks. The numbers show susceptibility, not a timeline. Screen-based information work scores high: paralegals, financial analysts, writers, software developers all scored 9 out of 10. Construction laborers, home health aides, roofers scored 1 or 2. Jobs earning over $100K averaged 6.7 on exposure. Jobs under $35K averaged 3.4. What that tells you is where AI capability and job-task overlap is high — not what any specific company is doing about it, or what happens to the people whose work lands in those categorie
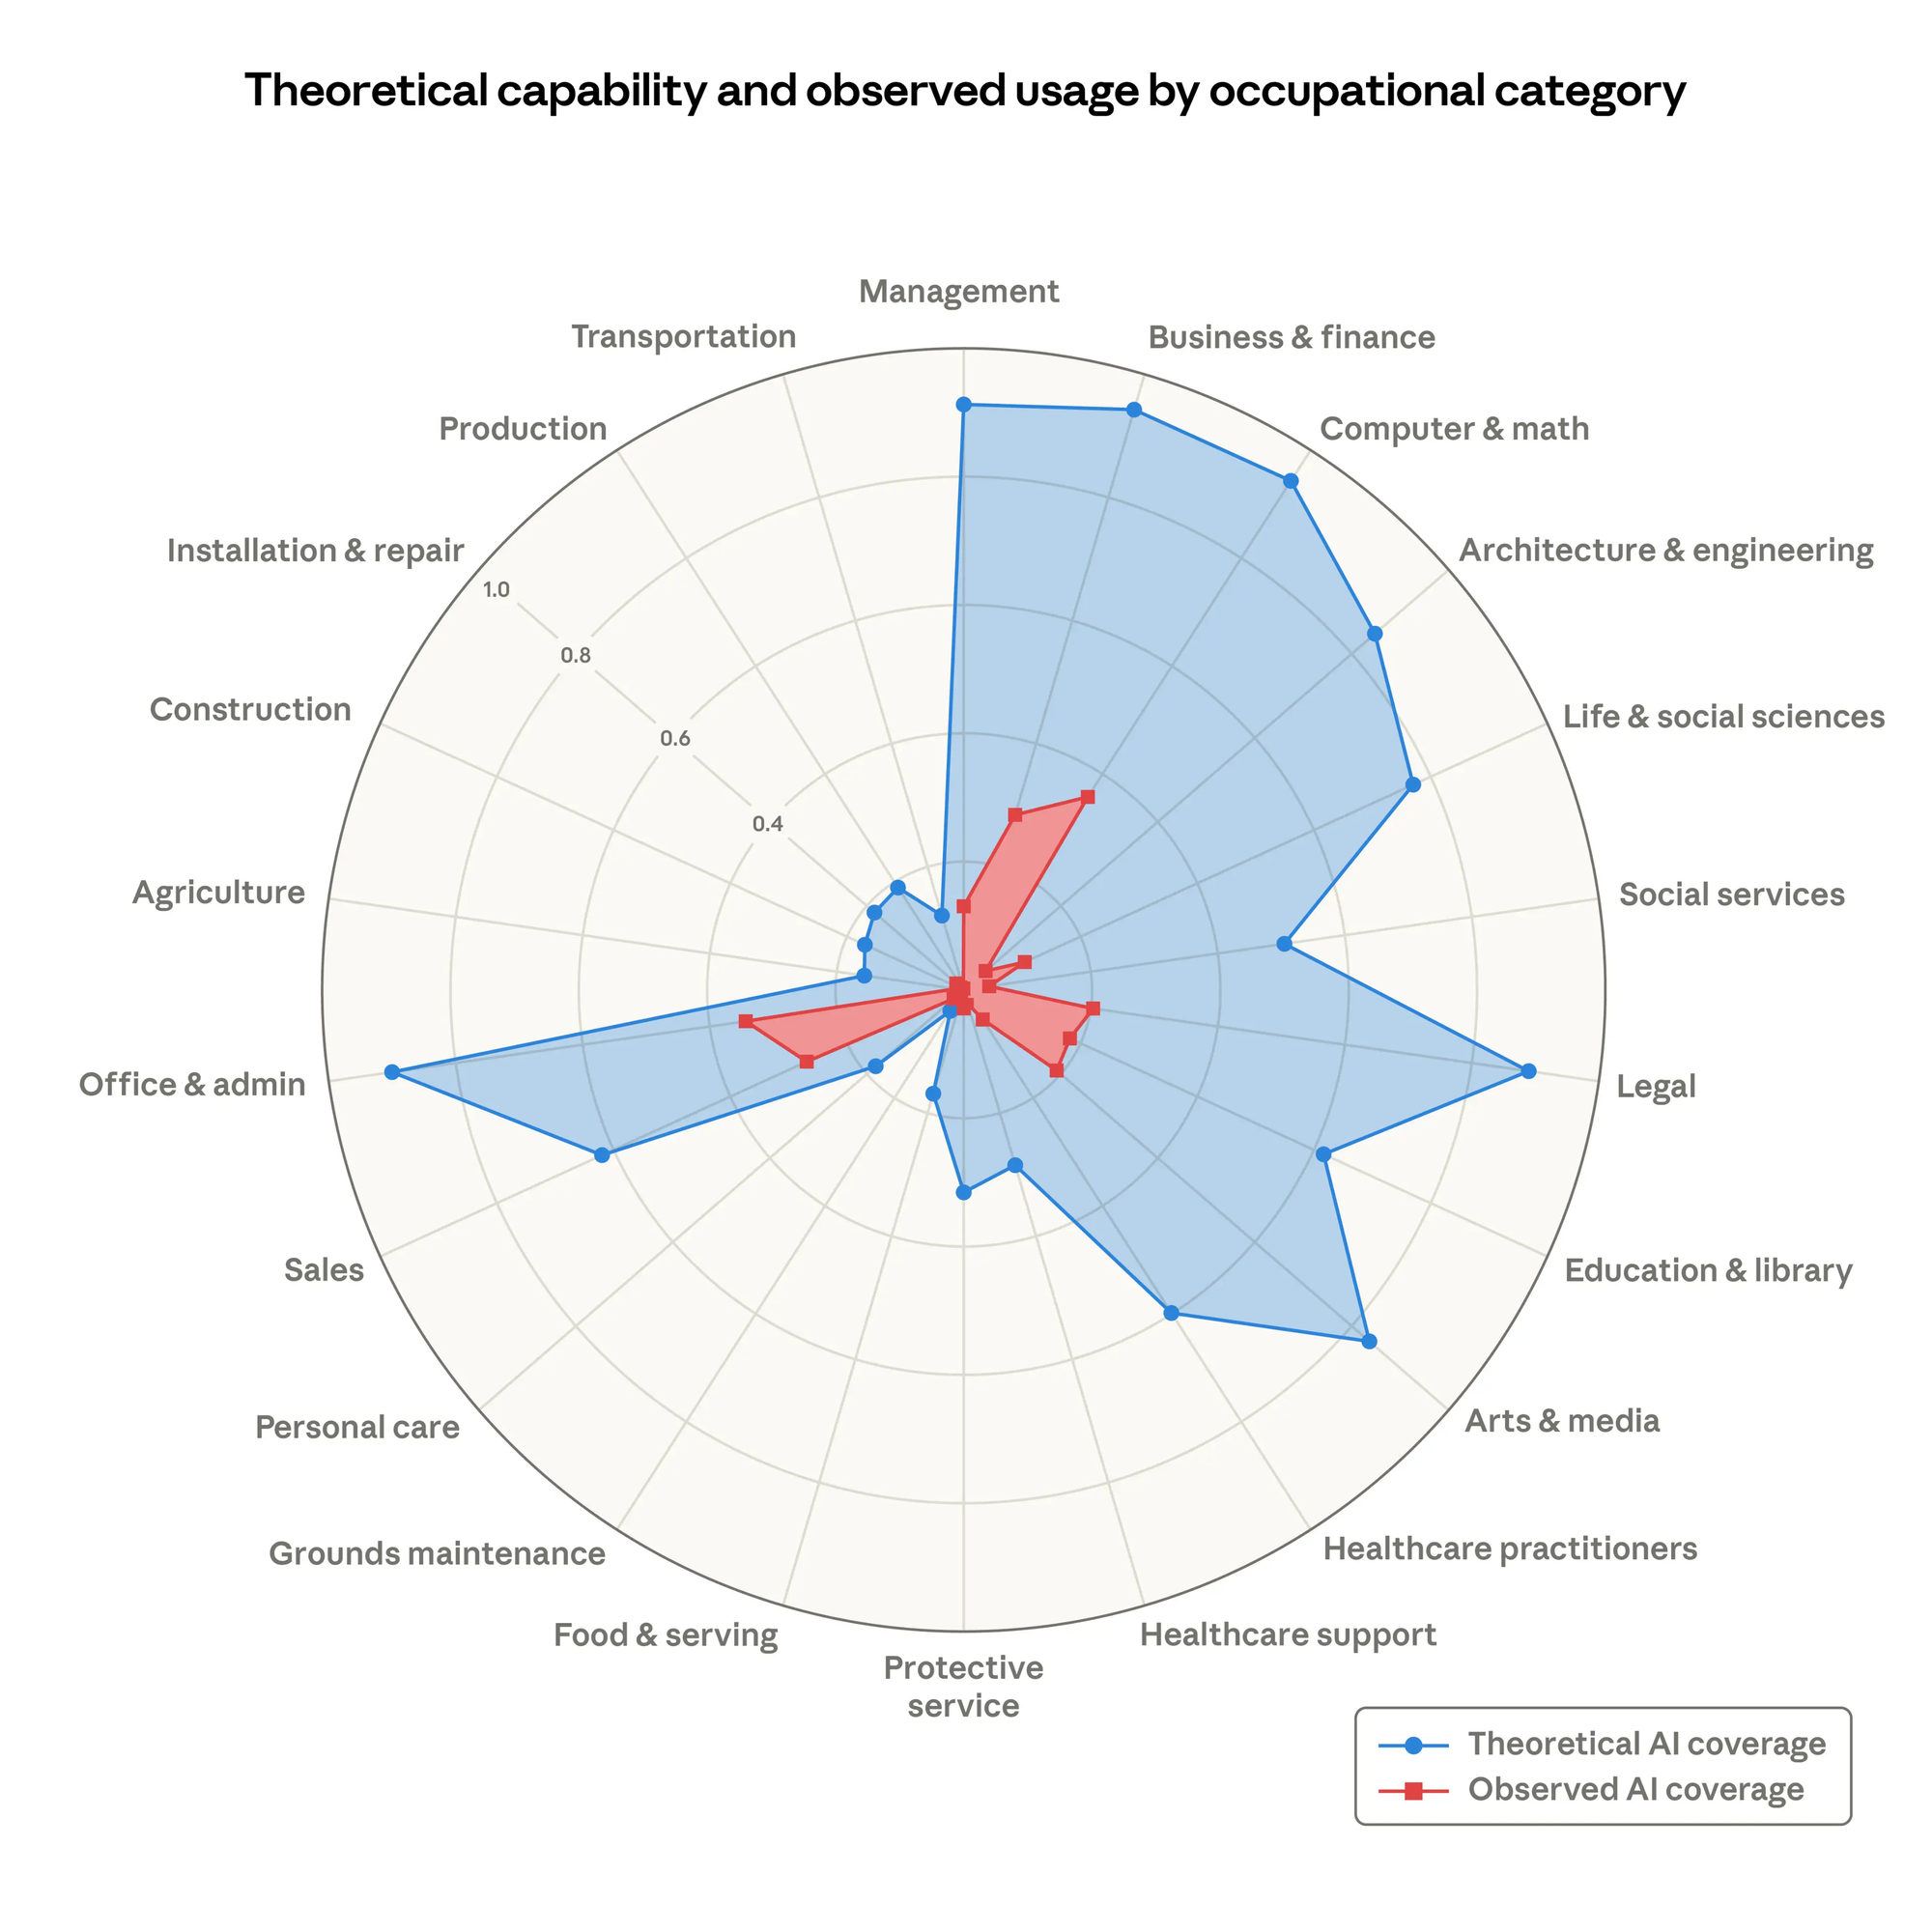
Anthropic's own research on labor market impacts draws exactly this distinction. Their "observed exposure" framework found that while Computer and Math occupations show 94% theoretical AI feasibility, only 33% shows actual observed coverage in real usage. The gap between what AI can theoretically do and what organizations actually deploy it for is enormous – and it's driven by factors the exposure score doesn't capture: legal constraints, verification requirements, integration costs, organizational inertia.
Where exposure maps work, and doesnt
Here's where I see the map doing real work: prioritization. If you're a workforce planner, a policymaker, or a product team building for professional services, knowing where capability and task overlap is high tells you where to pay attention first. It's a screening tool. It tells you which conversations to have, not what conclusions to reach.
Where it breaks down is decisions. A score of 9 for paralegals doesn't mean your legal team is redundant. It means you should be asking what they're actually doing with AI, which tasks it's handling, and where human judgment is still doing the work that matters. Those are governance questions, not exposure questions. The map gets you to the threshold of the conversation. What you do next is the harder part.
The legal profession under the lens
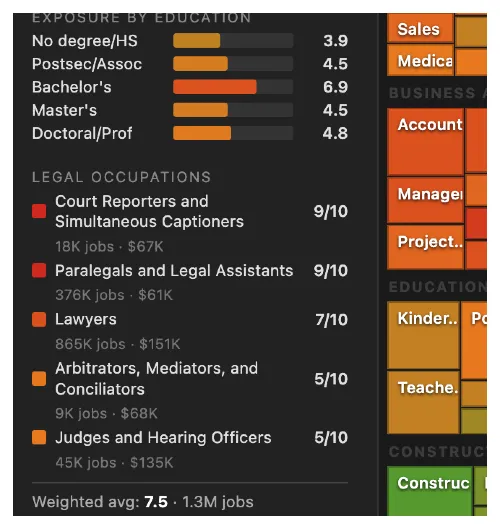
I added a Legal Occupations spotlight to my version because this is my world, and the scores warrant examination. The legal category averages 7.5 weighted by employment – nearly double the overall 4.4. But take a look at the distribution:
- Court reporters: 9/10. Real-time transcription is a near-perfect AI use case. Fully digital output, no physical component.
- Paralegals: 9/10. Legal research, document review, contract analysis, brief drafting. Core LLM territory.
- Lawyers: 7/10. Research and drafting are highly exposed. Client relationships, courtroom advocacy, and strategic judgment are not.
- Judges: 5/10. Human authority requirements and constitutional considerations create a floor that AI capability alone can't breach.
The gap between paralegals at 9 and judges at 5 shows why "exposure" requires context. Both are legal professionals. Their AI exposure profiles share almost nothing in common.
The practical question isn't whether AI will reshape legal work, it's whether your organization is designing that reshape deliberately or letting it happen by default. In my experience, the teams that start with "which tasks change first" rather than "which roles disappear" make better decisions.
What comes next
I rebuilt this because governance conversations need grounded starting points. Karpathy gave us a useful one. The error isn't in the data — it's in treating a single metric as a forecast rather than a frame. Used well, this kind of mapping helps organizations ask better questions before they make decisions that affect people's work.
Agentic Summer was when everyone drew the blueprints. Workflow Summer is when you realize you need permits, load-bearing walls, and someone who knows where the pipes are.
The companies that will thrive aren't the ones with the most capable agents. They're the ones that figured out how to fit agents into structured workflows where accountability is clear, outputs are auditable, and humans know exactly when they're still in the loop.
The blueprint era is over. We're in the foundation era.

